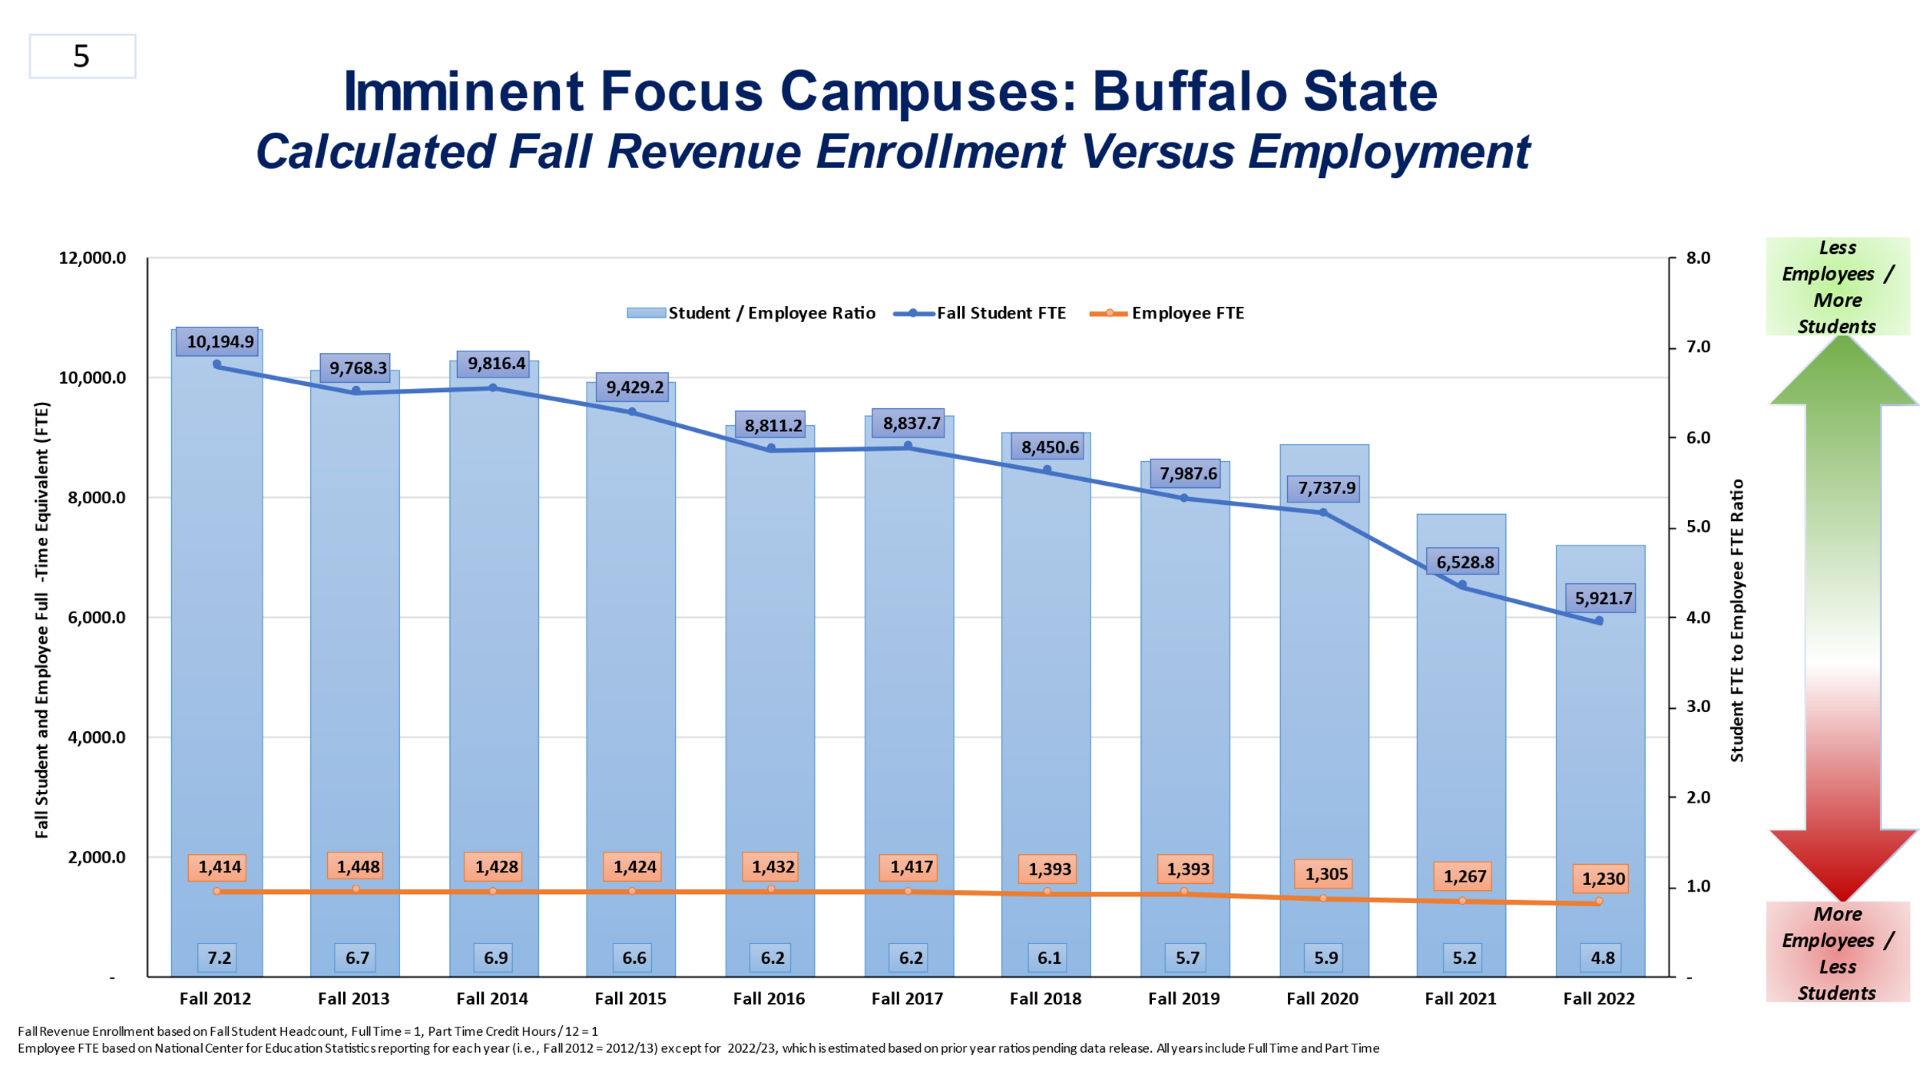
This above chart, titled "Imminent Focuses Campuses: Buffalo State -- Calculated Fall Revenue Enrollment Versus Employment", shows, over the course of an 11-year period, beginning in the fall of 2012, a decline in enrollment that outpaces a decline in employment. The student-to-employee ratio was 7.2 in 2012, and 4.8 in 2022.
In 2012, fall student full-time equivalent enrollment was 10,194.9, full-time equivalent employees were 1,414, and the student-to-employee ratio was 7.2.
In 2013, fall student full-time equivalent enrollment was 9,768.3, full-time equivalent employees were 1,448, and the student-to-employee ratio was 6.7.
In 2014, fall student full-time equivalent enrollment was 9,816.4, full-time equivalent employees were 1,428, and the student-to-employee ratio was 6.9.
In 2015, fall student full-time equivalent enrollment was 9,429.2, full-time equivalent employees were 1,424, and the student-to-employee ratio was 6.6.
In 2016, fall student full-time equivalent enrollment was 8,811.2, full-time equivalent employees were 1,432, and the student-to-employee ratio was 6.2.
In 2017, fall student full-time equivalent enrollment was 8,837.7, full-time equivalent employees were 1,417, and the student-to-employee ratio was 6.2.
In 2018, fall student full-time equivalent enrollment was 8450.6, full-time equivalent employees were 1,393, and the student-to-employee ratio was 6.1.
In 2019, fall student full-time equivalent enrollment was 7,987.6, full-time equivalent employees were 1,393, and the student-to-employee ratio was 5.7.
In 2020, fall student full-time equivalent enrollment was 7,737.9, full-time equivalent employees were 1,305, and the student-to-employee ratio was 5.9.
In 2021, fall student full-time equivalent enrollment was 6,528.8, full-time equivalent employees were 1,267, and the student-to-employee ratio was 5.2.
In 2022, fall student full-time equivalent enrollment was 5,921.7, full-time equivalent employees were 1,230, and the student-to-employee ratio was 4.8.

